Kalliope Wall Monitor
Are you sure you have an efficient contact centre?
Do you want to improve your customer satisfaction and monitor the productivity of your customer care operators?
Wall Monitor is the module that provides a global and real-time perspective of call and operator management within a contact centre.
Control your Contact Centre and optimise its performance
Kalliope Wall Monitor is the ideal solution for optimising call centre operations and increasing business efficiency, with:
Optimising workflows, increasing operator productivity and reducing waiting times
Data-driven decisions: thanks to detailed reports, performance can be analysed
and informed decisions made
More control: Wall Monitor’s comprehensive overview enables better control of call centre operations
An overall view

Real-time overview

Performance Monitoring

Graphical representation of call queuing time

Supervisor Dedicated Tools
Manage your operators with ease
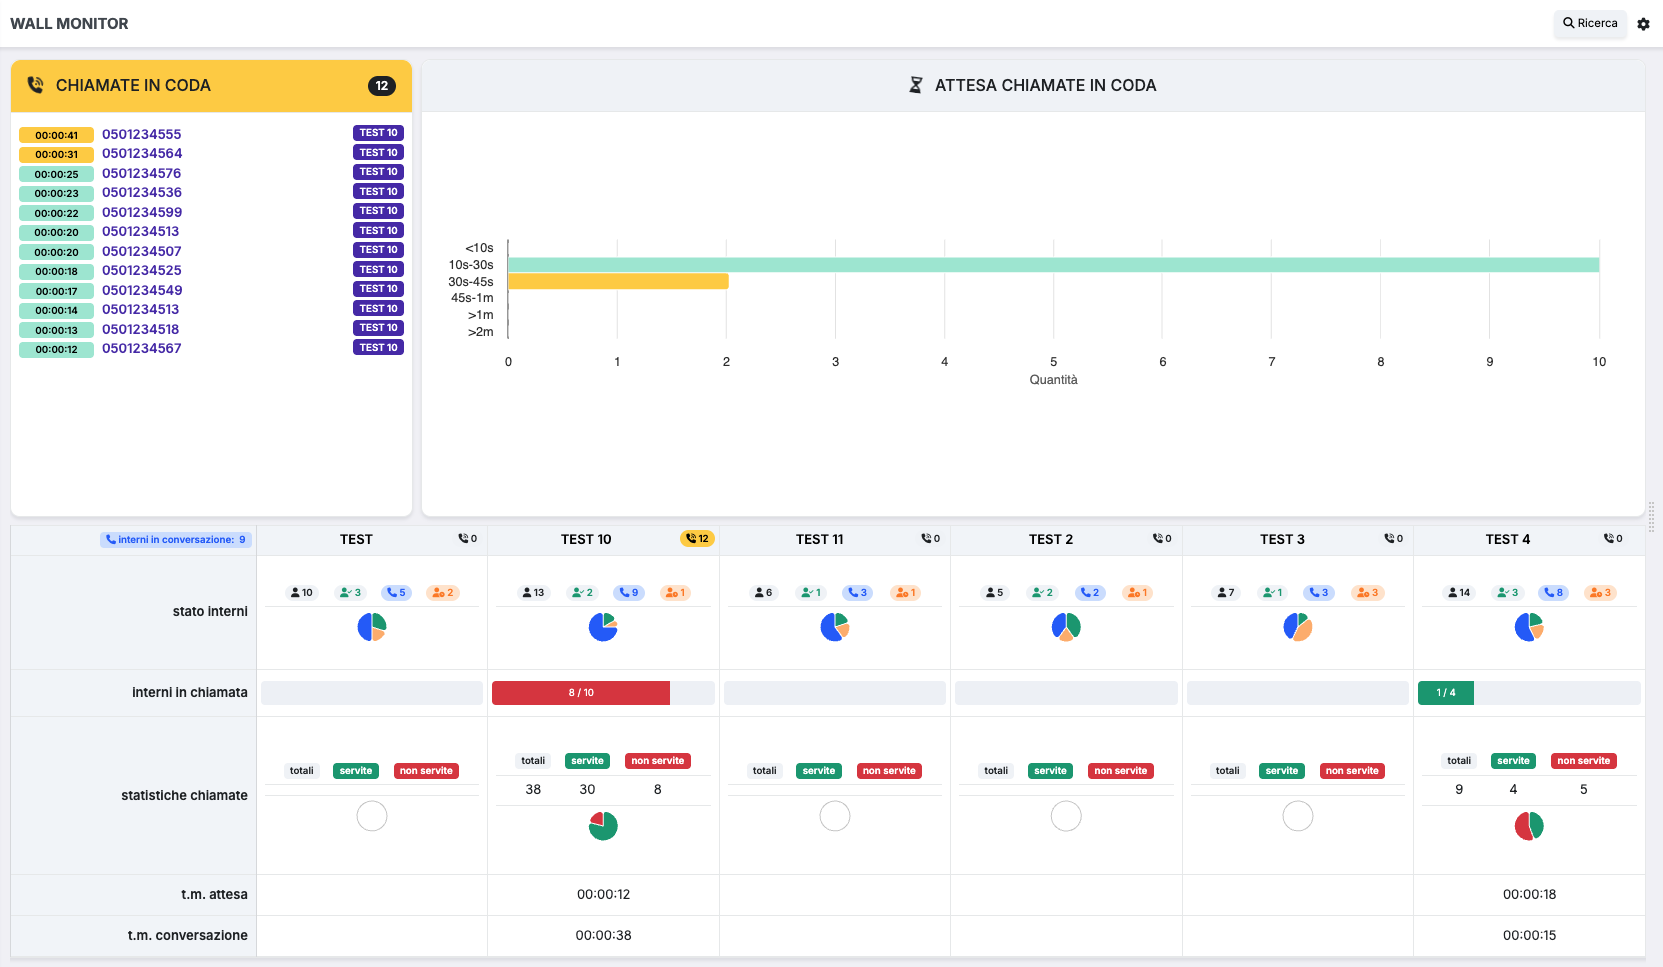
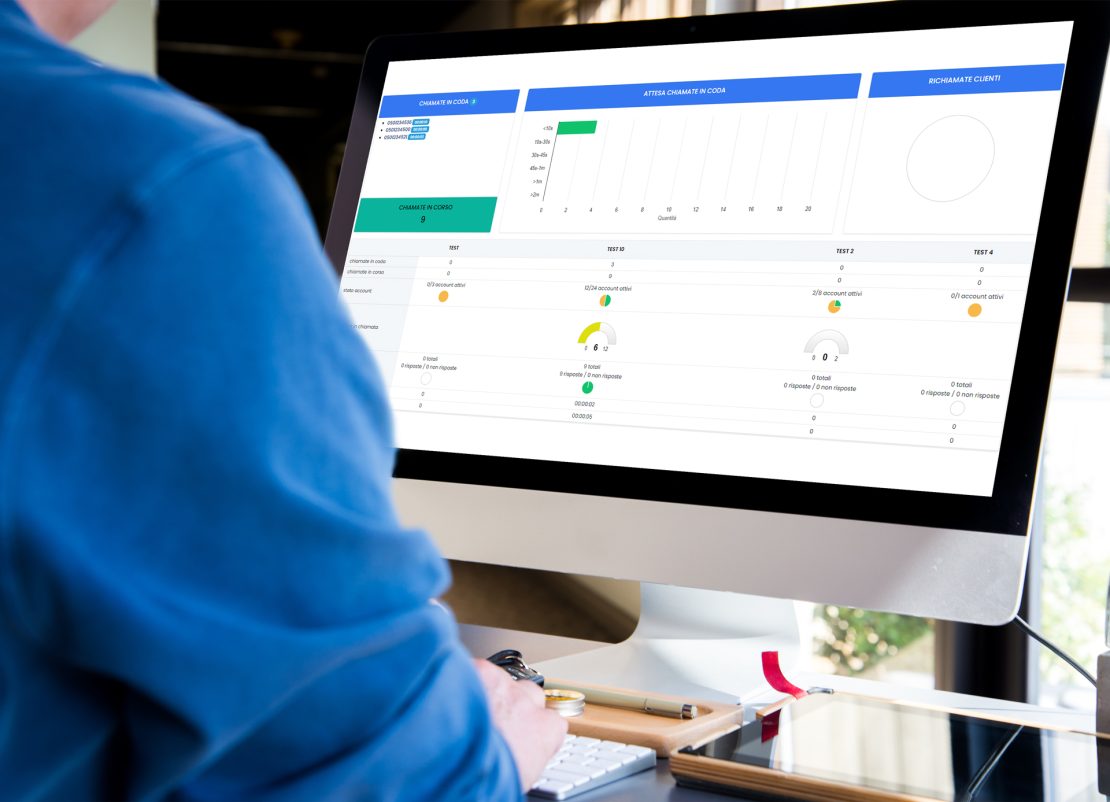
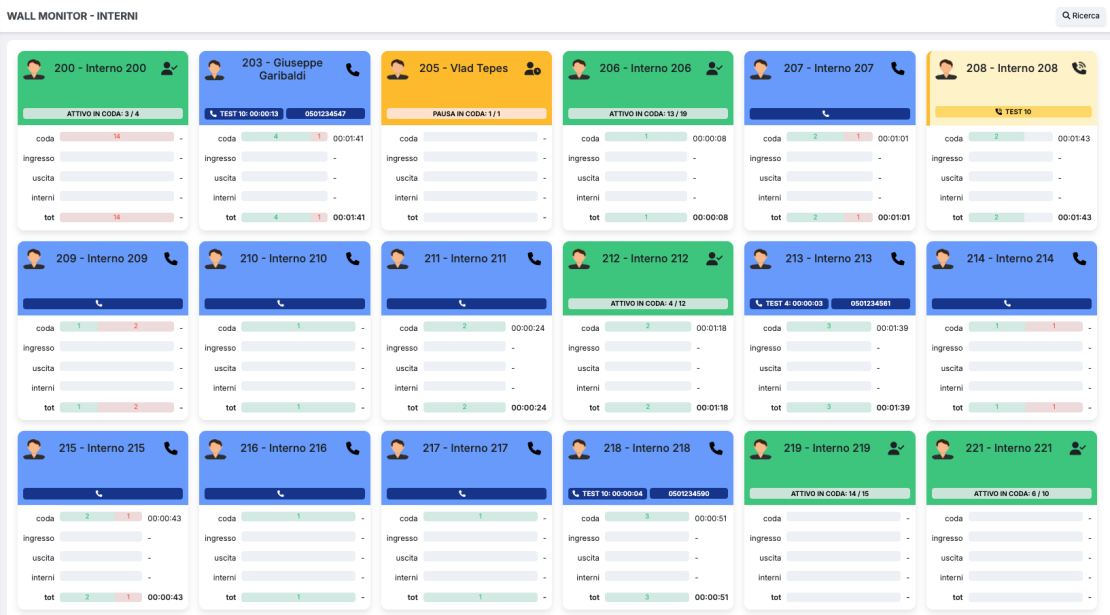
Wall monitor
Graphs and data provide an immediate and clear view of calls waiting in queues, customer callbacks, as well as account status and call statistics for each specific queue.
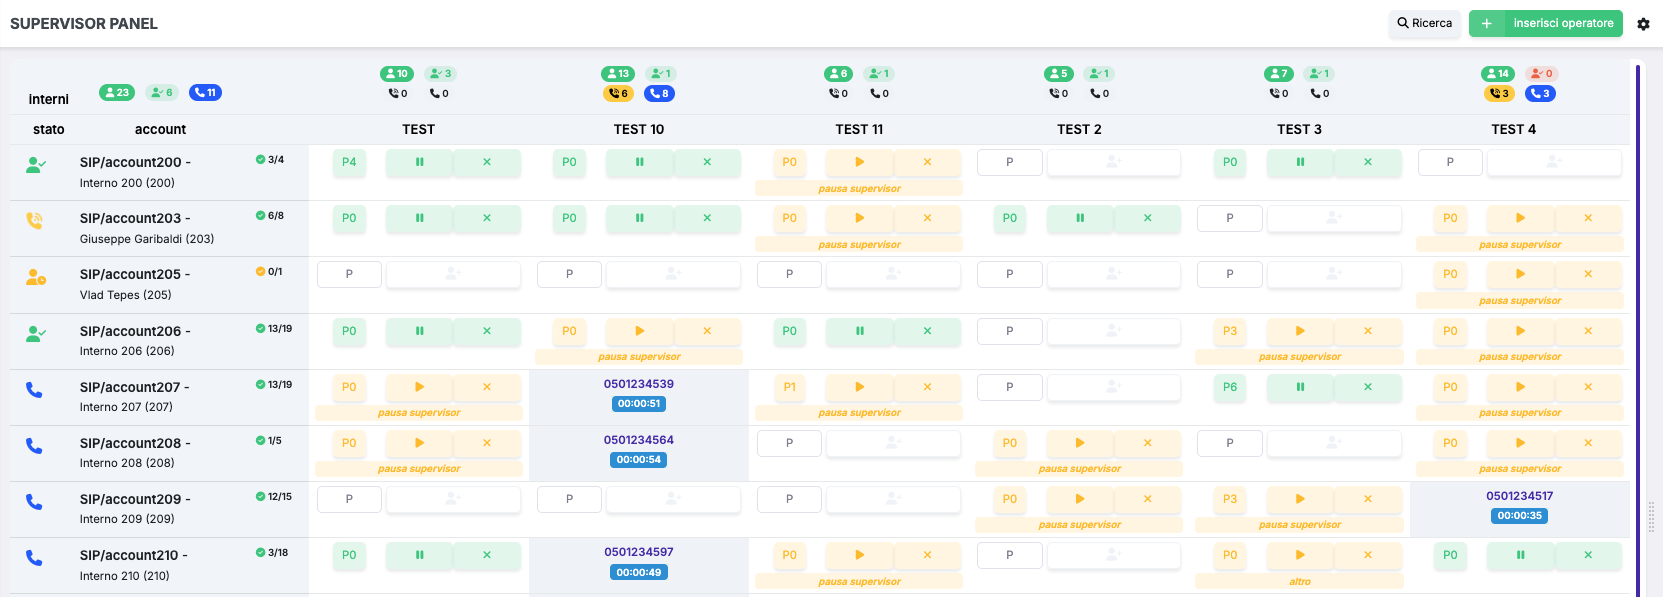
Supervisor Panel
The panel allows the supervisor to monitor both the status of operators (active, inactive, paused, on call) and the number of queues on which they are operating, and to manage operators by adding or removing them from pauses or queues.

Supervisor Panel Admin
The panel allows operators to be managed (add/remove from pause or queue) permanently (i.e. with the configurations made remaining active even after the operators log out).
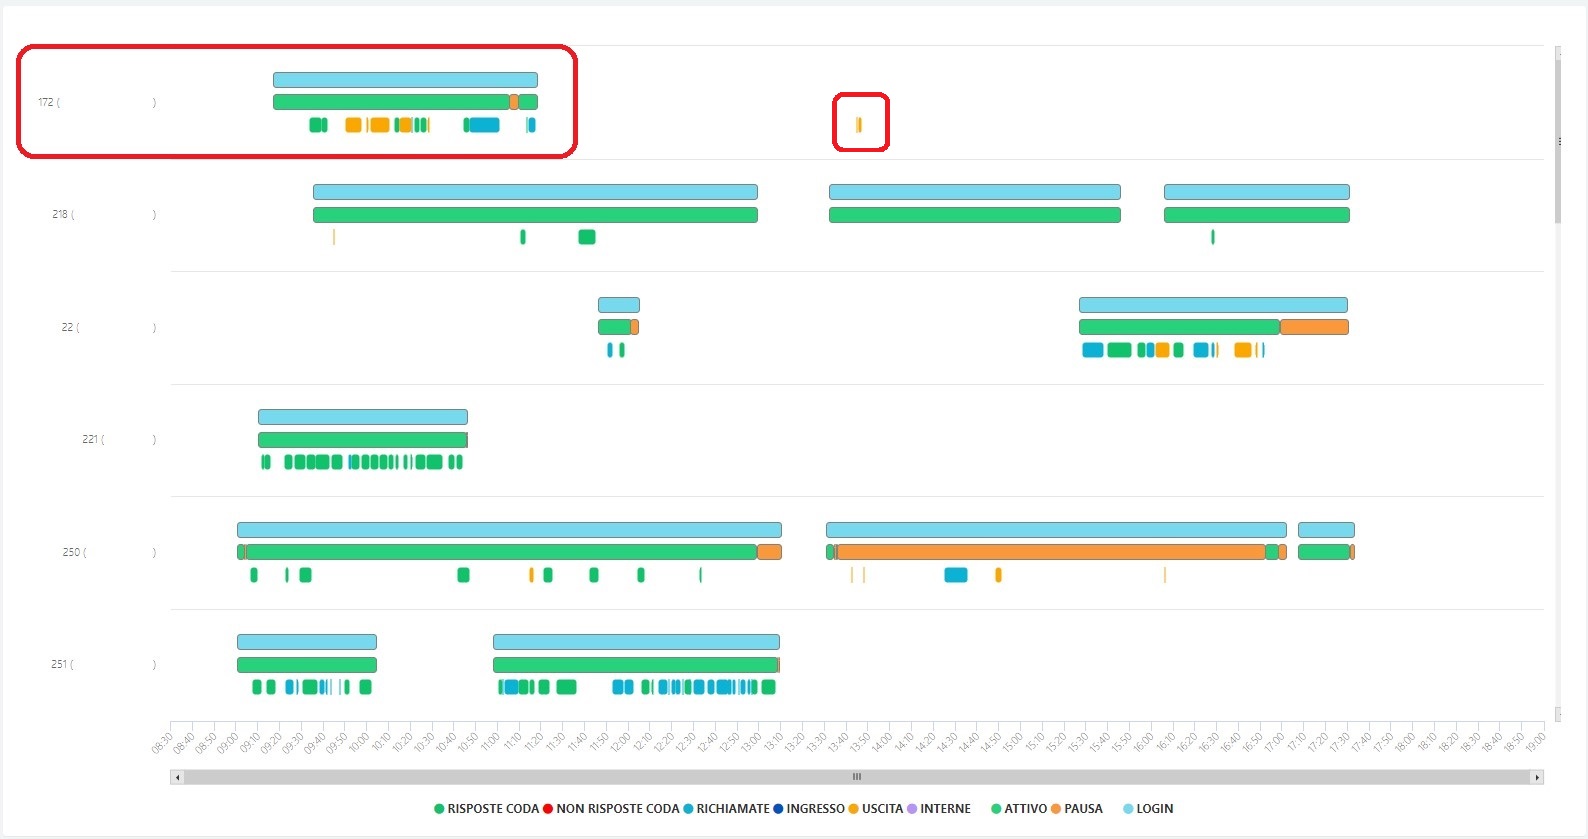
Operator Activity Report
Overall view of operator activity to identify call trends and check their activity and login periods by time.
The weekly distribution is also shown in a table with the same degree of detail and with the possibility of exporting to XLSX format. In addition to the reports in the dashboard, customised reports can be created based on the desired parameters.
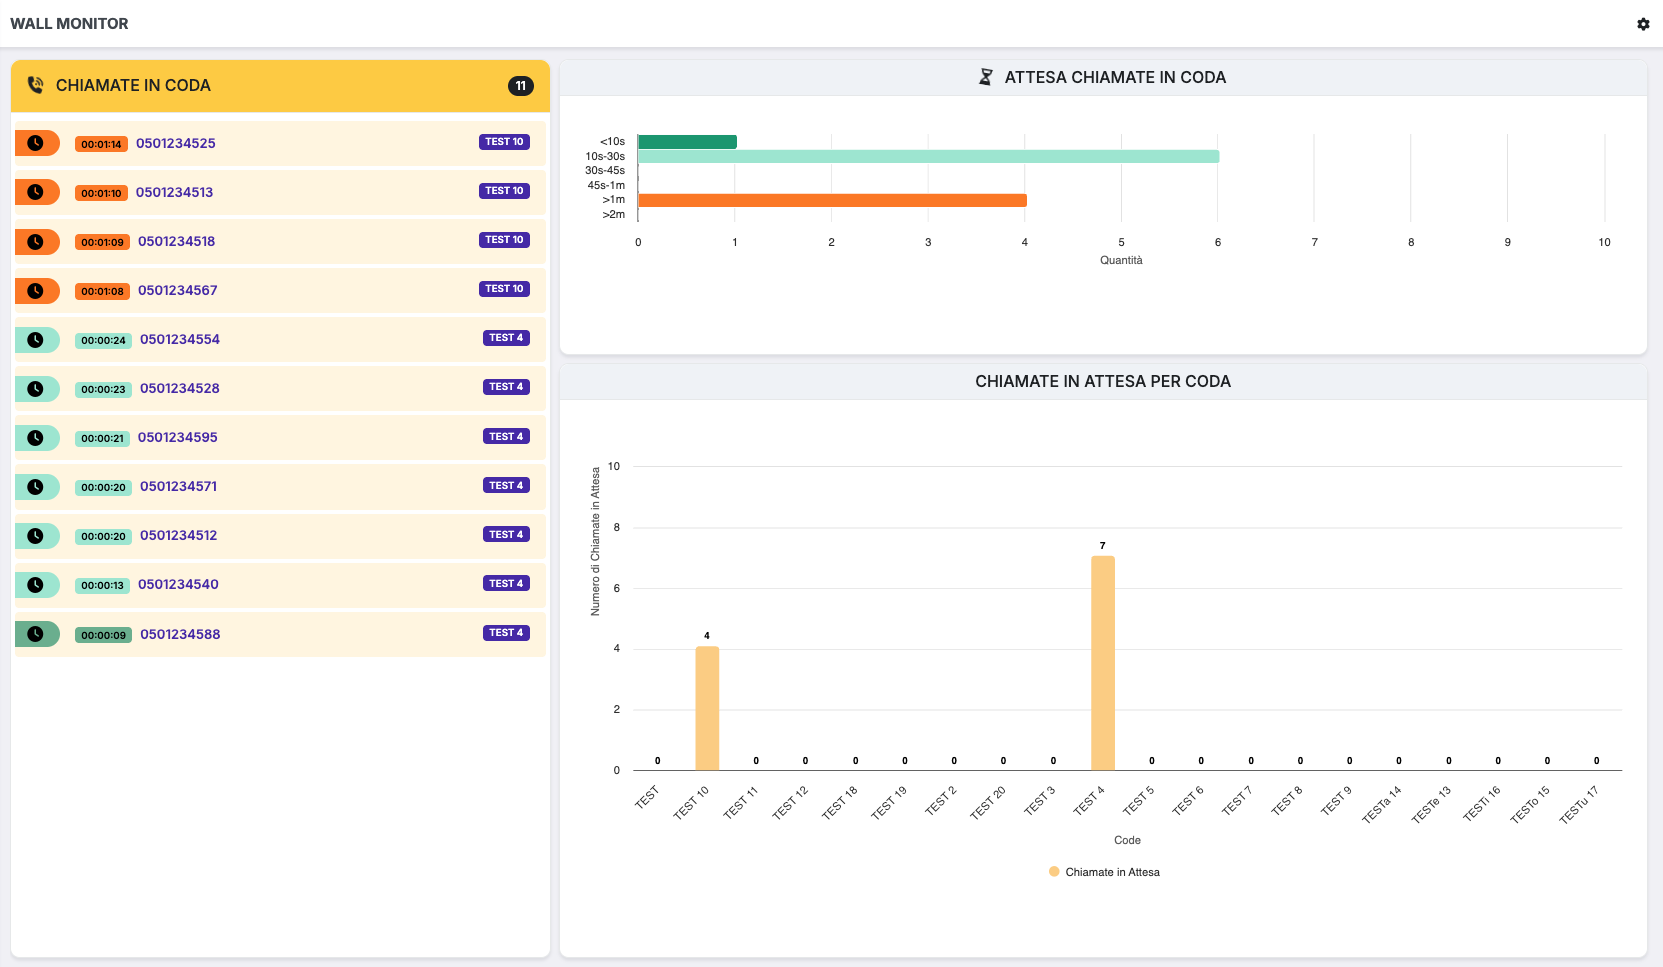
Waiting in the queue
This section shows call waiting information in detail. At a glance, essential data such as the telephone number of the caller, the talk time and the queue to which the call on hold belongs can be identified. The graphs also show the amount of calls in the queue, with the corresponding waiting time (in seconds) and the amount of calls on hold per queue.

Find out more
Discover all the technical details and insights in the dedicated section of our Wiki.
Download PDF
Need a concise overview? Download the flyer with key product information.
Contact us