
Kalliope Analytics
How much do you know about your company’s telephone flows?
Have you ever thought of having a real data warehouse (hitherto untapped) at your disposal, thanks to which you can finally optimise your business processes?
Transform your call data into valuable information with Kalliope Analytics, the advanced reporting module that offers a comprehensive and detailed overview of the use of your company’s telephone resources.
Kalliope Analytics: the advanced reporting module of the Nexus platform
Kalliope Analytics collects all the data collected from CDRs (Call Detail Records) by processing simple and intuitive graphs and reports to analyse call trends within your company.
The module is structured in two main sub-modules, both of which are divided into sections. The first sub-module collects the data from the CDR and processes them, while the second does so for data from the Call Centre. In both cases, the structure of the sections is very similar, with an initial dashboard followed by the various report sections. The data that are collected are then processed and made available to the various reporting groups (CDR or Call Centre) in the different sections into which they are divided.
The data behind everything

Clear and comprehensive dashboards

Professional and intuitive reporting

Effective and accurate graphics

Customising tables and reports
Choose what to monitor
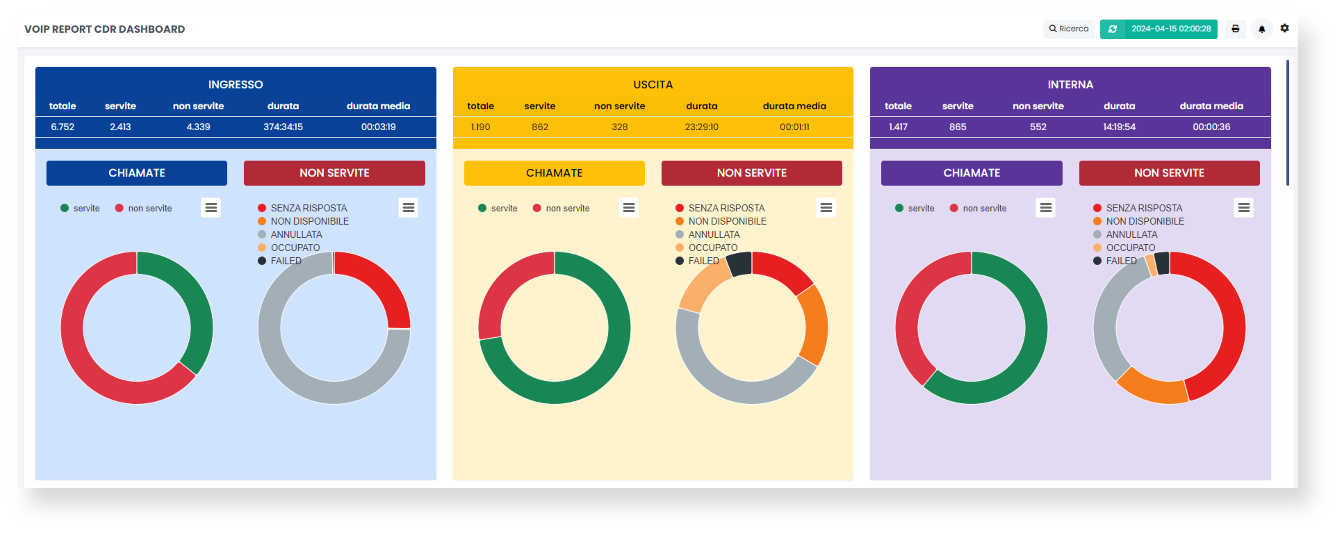
Dashboard: a first glance
An initial overview of incoming, outgoing and internal calls, with pie charts showing, for each category, the percentage and quantity of served and unserved calls, with details of the unserved (unanswered, unavailable, cancelled, busy and failed).
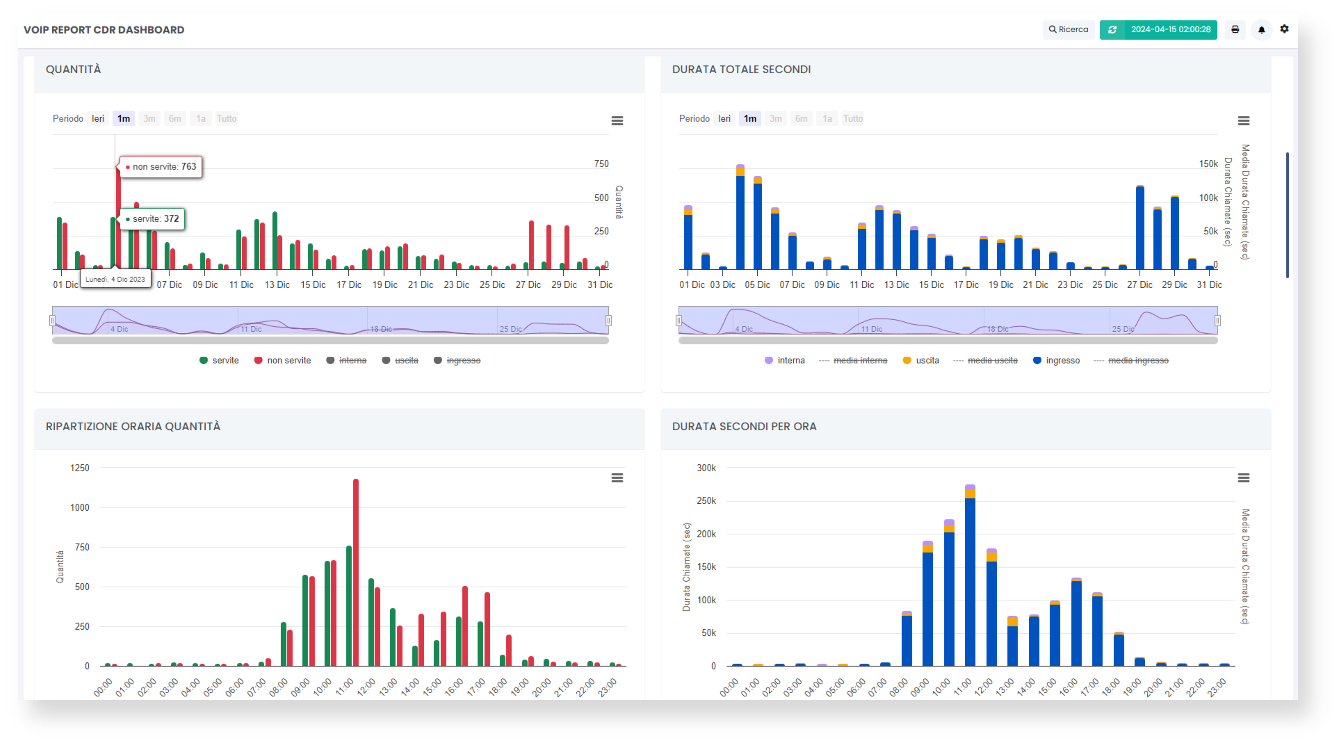
Flow trends
The dashboard contains graphs showing by quantity and total duration (in seconds) the trend of calls received on a specific day and time.
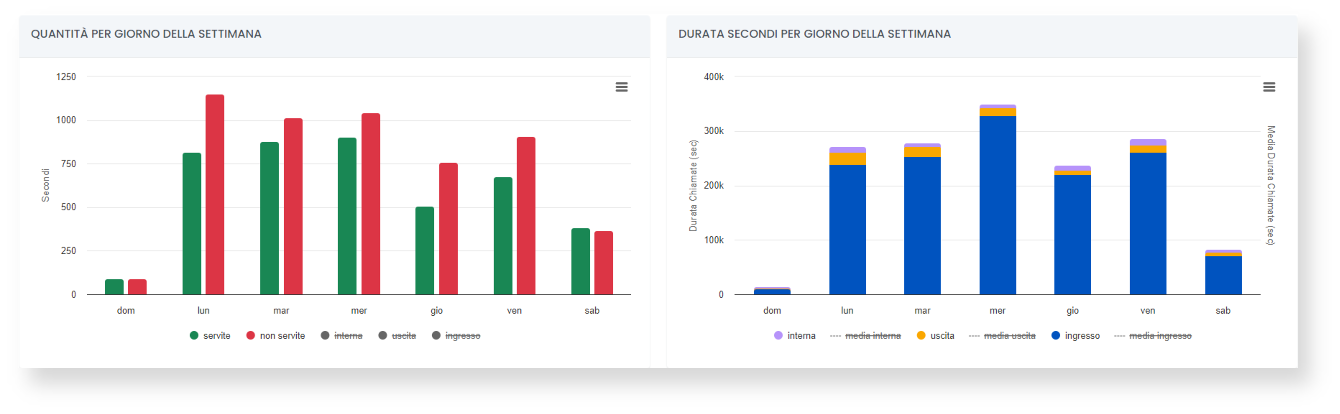
Weekly distribution
Breakdown of data (number of calls and their duration) by day of the week.
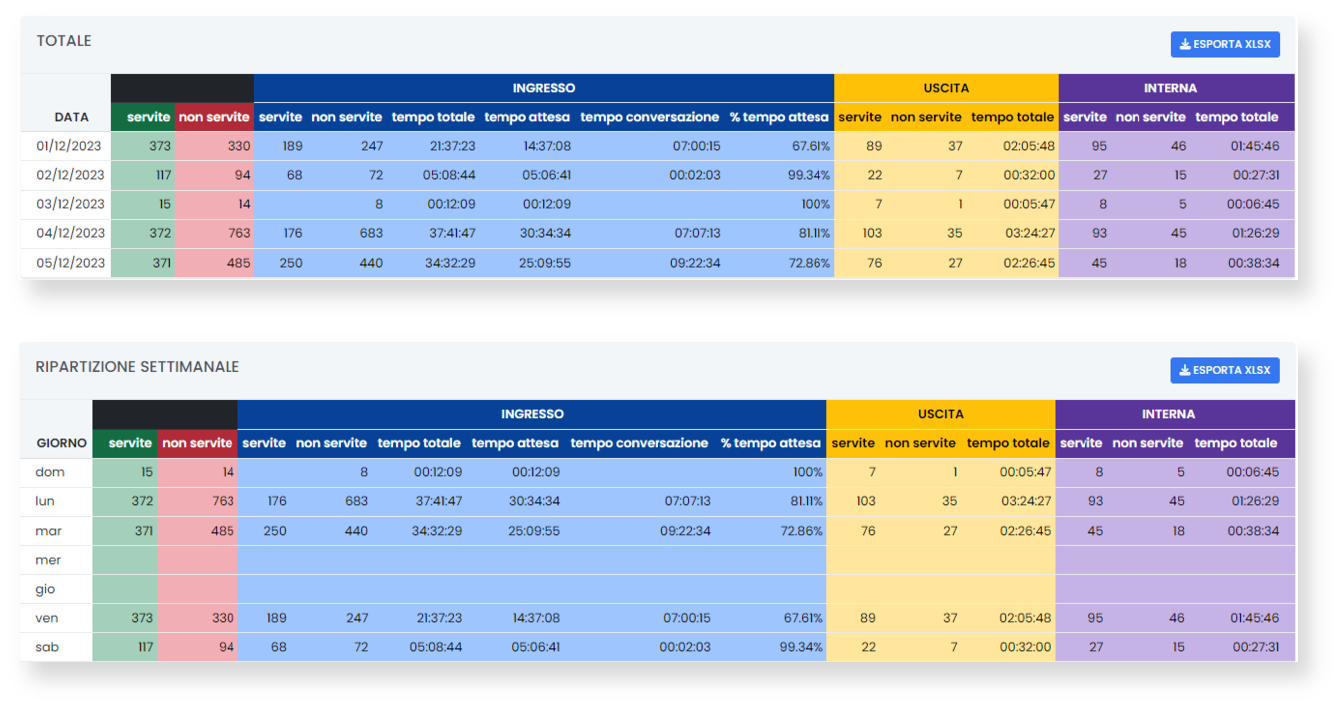
Report by date and day of the week
The scenario represented at a glance by the graphs is shown in more detail in the table, with a breakdown by served/unserved, incoming, outgoing, internal calls, with the possibility of exporting the data in XLSX format.
The weekly distribution is also shown in the table with the same degree of detail and with the possibility of exporting the data in XLSX format. In addition to the reports in the dashboard, customised reports can be created based on the desired parameters.
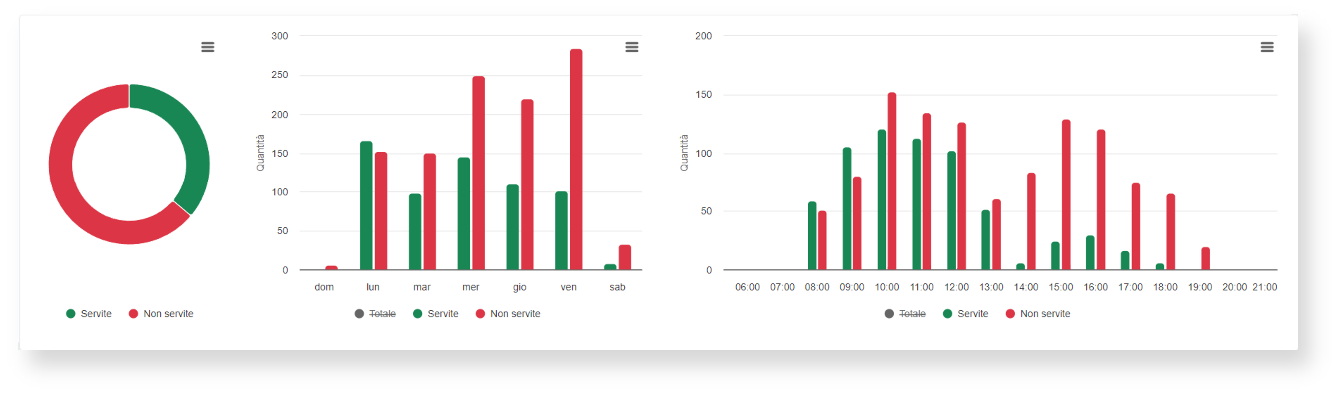
Unserved calls
The pie chart representation with hourly/weekly distribution makes it possible to identify the most critical periods at a glance.
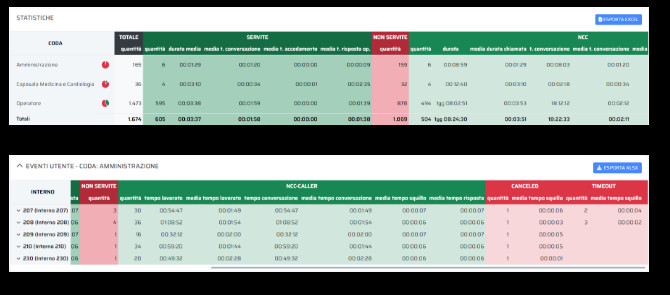
Statistics and tail details
The analytical report makes it possible to read the overall scenario in more detail, identifying the situation regarding the various queues.
The individual queue can then be analysed in more detail, examining the flows related to each individual extension.

Find out more
Discover all the technical details and insights in the dedicated section of our Wiki.
Download PDF
Need a concise overview? Download the flyer with key product information.
Contact us